Grafana and Prometheus on a VPS for Server Monitoring
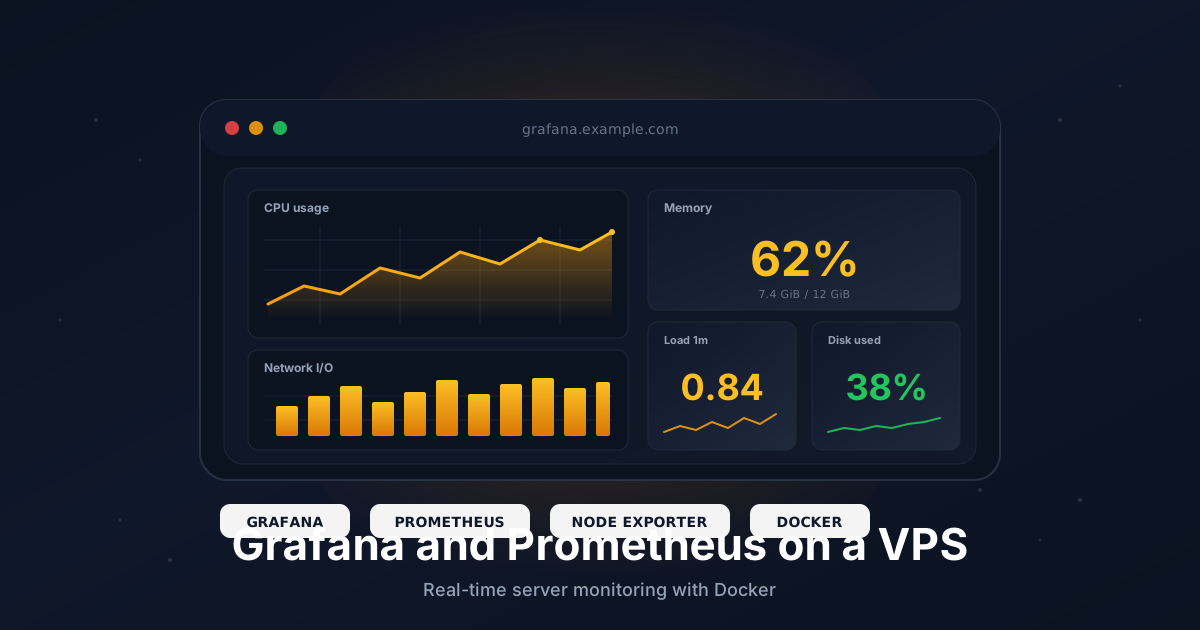
If you run anything on a VPS, you eventually want to know what it's doing. CPU, memory, disk, network, container restarts, request rates. The duo most teams reach for is Prometheus to scrape metrics and Grafana to graph them. Both are open source, both run happily in Docker, and together they cost about 200 MB of RAM on a small box.
This tutorial sets up a production-shaped install: Prometheus, Grafana, and node_exporter behind Caddy with automatic HTTPS, persistent volumes for both data stores, a community dashboard for host metrics, and alerts wired into a Discord or Slack webhook.
TL;DR
- Install Docker and Docker Compose on a fresh VPS
- Point a subdomain like
grafana.example.comat your server - Run Prometheus + Grafana + node_exporter with one
docker-compose.yml - Scrape host metrics with node_exporter on the Docker network
- Import community dashboard
1860for instant node graphs - Change the default
admin/adminGrafana password on first login - Wire Grafana Unified Alerting to a Discord or Slack webhook
Total time: around 20 minutes.
What You Need
- A VPS with at least 1 GB RAM (2 GB recommended) running Ubuntu 22.04 or 24.04
- A domain you can add DNS records to
- Ports
80and443open to the internet - Root or sudo access
- A Discord or Slack incoming webhook URL (optional, for alerts)
Prometheus and Grafana are light, but Prometheus retention plus a dashboard or two grows over time. Plan for around 1 GB of disk per month of metrics on a small fleet.
Step 1: Point a Subdomain at Your VPS
In your DNS provider, add an A record:
grafana.example.com → YOUR_VPS_IPV4
Add an AAAA record for IPv6 if you use it. Verify propagation:
dig +short grafana.example.com
DNS needs to resolve before Caddy can fetch a Let's Encrypt certificate.
Step 2: Install Docker and Docker Compose
On a fresh Ubuntu server:
sudo apt update
sudo apt install -y ca-certificates curl

sudo install -m 0755 -d /etc/apt/keyrings
sudo curl -fsSL https://download.docker.com/linux/ubuntu/gpg \
  -o /etc/apt/keyrings/docker.asc
sudo chmod a+r /etc/apt/keyrings/docker.asc

echo "deb [arch=$(dpkg --print-architecture) signed-by=/etc/apt/keyrings/docker.asc] \
  https://download.docker.com/linux/ubuntu $(. /etc/os-release && echo $VERSION_CODENAME) stable" | \
  sudo tee /etc/apt/sources.list.d/docker.list > /dev/null

sudo apt update
sudo apt install -y docker-ce docker-ce-cli containerd.io docker-buildx-plugin docker-compose-plugin
Confirm:
docker --version
docker compose version
Step 3: Open the Firewall
sudo ufw allow 22/tcp
sudo ufw allow 80/tcp
sudo ufw allow 443/tcp
sudo ufw enable
Caddy needs 80 for the ACME HTTP challenge and 443 for HTTPS. Prometheus, Grafana, and node_exporter stay on the internal Docker network.
Step 4: Create the Project Directory
sudo mkdir -p /opt/monitoring
cd /opt/monitoring
sudo mkdir -p prometheus-data grafana-data caddy-data caddy-config
Grafana's container runs as UID 472, and Prometheus runs as UID 65534 (nobody). Make sure both can write to their volumes:
sudo chown -R 472:472 /opt/monitoring/grafana-data
sudo chown -R 65534:65534 /opt/monitoring/prometheus-data
Skip this and your containers will crash-loop with permission-denied errors.
Step 5: Write the Prometheus Config
Create /opt/monitoring/prometheus.yml:
global:
  scrape_interval: 15s
  evaluation_interval: 15s
  external_labels:
    monitor: "vps"

scrape_configs:
  - job_name: "prometheus"
    static_configs:
      - targets: ["localhost:9090"]

  - job_name: "node"
    static_configs:
      - targets: ["node_exporter:9100"]
        labels:
          instance: "vps-1"
A few notes:
- Targets use the Docker service names, not
localhost. Containers on the same network resolve each other by name. - A 15 second scrape interval is plenty for a single host. Crank it down later if you start collecting application metrics.
- Add a job per service you want to monitor. The
node_exporterjob covers everything happening on the host itself.
Step 6: Write the Compose File
Create /opt/monitoring/docker-compose.yml:
services:
  prometheus:
    image: prom/prometheus:latest
    container_name: prometheus
    restart: unless-stopped
    command:
      - "--config.file=/etc/prometheus/prometheus.yml"
      - "--storage.tsdb.path=/prometheus"
      - "--storage.tsdb.retention.time=30d"
      - "--web.enable-lifecycle"
    volumes:
      - ./prometheus.yml:/etc/prometheus/prometheus.yml:ro
      - ./prometheus-data:/prometheus
    networks:
      - monitoring

  node_exporter:
    image: prom/node-exporter:latest
    container_name: node_exporter
    restart: unless-stopped
    pid: host
    command:
      - "--path.procfs=/host/proc"
      - "--path.sysfs=/host/sys"
      - "--path.rootfs=/host"
      - "--collector.filesystem.mount-points-exclude=^/(sys|proc|dev|host|etc)($$|/)"
    volumes:
      - /proc:/host/proc:ro
      - /sys:/host/sys:ro
      - /:/host:ro,rslave
    networks:
      - monitoring

  grafana:
    image: grafana/grafana:latest
    container_name: grafana
    restart: unless-stopped
    depends_on:
      - prometheus
    environment:
      GF_SERVER_ROOT_URL: "https://grafana.example.com"
      GF_SECURITY_ADMIN_USER: "admin"
      GF_SECURITY_ADMIN_PASSWORD: "REPLACE_WITH_STRONG_PASSWORD"
      GF_USERS_ALLOW_SIGN_UP: "false"
    volumes:
      - ./grafana-data:/var/lib/grafana
    networks:
      - monitoring

  caddy:
    image: caddy:2
    container_name: monitoring-caddy
    restart: unless-stopped
    ports:
      - "80:80"
      - "443:443"
    volumes:
      - ./Caddyfile:/etc/caddy/Caddyfile:ro
      - ./caddy-data:/data
      - ./caddy-config:/config
    networks:
      - monitoring

networks:
  monitoring:
A few things worth calling out:
- node_exporter mounts
/proc,/sys, and/read-only so it can read host metrics without leaving Docker.pid: hostlets it see real process counts. - The
$$in the mount-points-exclude regex is intentional. Compose treats a single$as a variable expansion, so it gets escaped. --web.enable-lifecyclelets you reload Prometheus withcurl -X POST http://prometheus:9090/-/reloadfrom inside the network without restarting the container.- Don't publish ports
9090or3000on the host. Caddy reaches both over the Docker network.
Step 7: Write the Caddyfile
Create /opt/monitoring/Caddyfile:
grafana.example.com {
    encode zstd gzip

    reverse_proxy grafana:3000
}

prometheus.example.com {
    encode zstd gzip

    basic_auth {
        admin REPLACE_WITH_BCRYPT_HASH
    }

    reverse_proxy prometheus:9090
}
Generate the bcrypt hash for the basic-auth line:
docker run --rm caddy:2 caddy hash-password --plaintext "your-strong-password"
Paste the output (it starts with $2a$) into the Caddyfile. If you don't need browser access to Prometheus directly, drop the prometheus.example.com block entirely and skip making that DNS record. Grafana queries Prometheus over the internal Docker network either way.
Step 8: Start the Stack
cd /opt/monitoring
sudo docker compose up -d
sudo docker compose logs -f
Watch for Caddy issuing the certificate, then open https://grafana.example.com. Log in with admin and the password you set in the compose file.
Step 9: Add Prometheus as a Data Source
Inside Grafana:
- Click the gear icon (Connections) in the sidebar.
- Choose Data sources and click Add data source.
- Pick Prometheus.
- Set URL to
http://prometheus:9090. That's the Docker service name, notlocalhost. - Leave authentication empty and click Save & test.
You should see a green "Successfully queried the Prometheus API" message.
Step 10: Import the Node Exporter Dashboard
The community dashboard 1860 (Node Exporter Full) is the one most people use. It gives you CPU, memory, disk, network, and filesystem panels with sensible defaults.
- In Grafana, click the + icon in the sidebar and choose Import dashboard.
- In the Find and import dashboards field, type
1860and click Load. - On the next screen, pick your Prometheus data source from the dropdown.
- Click Import.
The dashboard loads with metrics from vps-1 (the label set in prometheus.yml). If you scrape more hosts later, the dashboard's host selector picks them up automatically.
A few other dashboards worth knowing:
12740for cAdvisor container metrics13639for blackbox_exporter HTTP probes1860is the canonical node_exporter board
Step 11: Set Up Alerting
Grafana's Unified Alerting is simpler than running a separate Alertmanager for a single VPS, and it speaks Discord and Slack natively.
Add a Contact Point
- In Grafana, go to Alerting then Contact points.
- Click Add contact point.
- Pick Discord (or Slack).
- Paste your incoming webhook URL.
- Click Test to make sure a message reaches the channel, then Save.
Create an Alert Rule
- Go to Alerting then Alert rules and click New alert rule.
- Pick the Prometheus data source.
- Use this query for high CPU usage:
100 - (avg by (instance) (rate(node_cpu_seconds_total{mode="idle"}[5m])) * 100)
- Set the condition to IS ABOVE 85 for 5 minutes.
- Pick a folder and an evaluation group (every 1 minute is fine).
- Under Notifications, route the alert to your Discord or Slack contact point.
A couple of starter queries you'll probably want too:
- Disk space low:
(node_filesystem_avail_bytes{mountpoint="/"} / node_filesystem_size_bytes{mountpoint="/"}) * 100 < 10 - Memory pressure:
(1 - (node_memory_MemAvailable_bytes / node_memory_MemTotal_bytes)) * 100 > 90 - Host down:
up{job="node"} == 0
If you'd rather use Alertmanager (better for multi-tenant setups, deduplication, silences, and fanning out to many receivers), add a fourth service to the compose file:
  alertmanager:
    image: prom/alertmanager:latest
    container_name: alertmanager
    restart: unless-stopped
    volumes:
      - ./alertmanager.yml:/etc/alertmanager/alertmanager.yml:ro
    networks:
      - monitoring
Then add alerting and rule_files blocks to prometheus.yml. For a single VPS, Grafana's built-in alerting is the lower-friction choice.
Step 12: Persist and Back Up
Everything important lives under /opt/monitoring:
prometheus-datais the time-series databasegrafana-dataholds dashboards, users, datasources, and the alert statecaddy-datakeeps the issued certificates so renewals don't restart the ACME flow
Back up the directory daily. Create /usr/local/bin/monitoring-backup.sh:
#!/usr/bin/env bash
set -euo pipefail

BACKUP_DIR="/var/backups/monitoring"
DATE="$(date +%F)"
mkdir -p "$BACKUP_DIR"

tar -czf "$BACKUP_DIR/grafana-$DATE.tar.gz" -C /opt/monitoring grafana-data
tar -czf "$BACKUP_DIR/prometheus-cfg-$DATE.tar.gz" \
  -C /opt/monitoring prometheus.yml docker-compose.yml Caddyfile

find "$BACKUP_DIR" -name "*.tar.gz" -mtime +14 -delete
Skip backing up prometheus-data itself unless you really need long-term retention. Reinstalling node_exporter and waiting a day rebuilds enough recent history for most teams. If you want years of metrics, use Grafana Mimir or remote-write to an object-storage backend instead of stuffing it onto the VPS.
Make the script executable and schedule it:
sudo chmod +x /usr/local/bin/monitoring-backup.sh
echo "20 3 * * * root /usr/local/bin/monitoring-backup.sh" | \
  sudo tee /etc/cron.d/monitoring-backup
Step 13: Upgrade the Stack
Pull and recreate everything:
cd /opt/monitoring
sudo docker compose pull
sudo docker compose up -d
Take a fresh grafana-data backup before bumping major Grafana versions. The internal database schema can change between releases, and rolling back means restoring the volume.
Troubleshooting
node_exporter shows zeros for everything. The host paths aren't bind-mounted. Confirm /proc, /sys, and / are mounted into the container, and that --path.rootfs=/host is set. Without those, the exporter reads from inside the container instead of the host.
Prometheus reports context deadline exceeded. The scrape target isn't reachable within the timeout. Check that node_exporter is on the same Docker network, that the service name matches the target in prometheus.yml, and that the container is healthy with docker compose ps. Long-running blackbox probes need a higher per-target scrape_timeout.
Grafana data source test fails with "HTTP Error Bad Gateway". You set the URL to http://localhost:9090. From inside the Grafana container, localhost is Grafana itself. Use http://prometheus:9090 so Docker's DNS resolves to the Prometheus container.
Imported dashboard panels are all empty. The dashboard expects different label names than your scrape config provides. Open a panel, click Edit, and check the query. Many community dashboards assume job="node-exporter" or a specific instance label. Either rename the job in prometheus.yml or edit the dashboard variables to match yours.
Caddy fails to obtain a certificate. DNS hasn't propagated, port 80 is blocked upstream, or another container is binding :80. Verify with dig and sudo ss -tulpn | grep :80.
Going Further
- Add Loki for log aggregation. It uses the same Grafana UI and pairs naturally with Prometheus alerts on log patterns.
- Add Tempo if you run apps with OpenTelemetry instrumentation. Distributed traces beside metrics is a huge debugging unlock.
- Add blackbox_exporter to probe HTTP, TCP, and DNS endpoints from outside your apps. Great for uptime alerts.
- Add snmp_exporter to scrape routers, switches, and UPS units. Combined with node_exporter, you get a single dashboard for host and network gear.
- Run a second Prometheus on another VPS with
remote_writeinto your main one for off-site monitoring of the monitoring server. The classic problem of "who watches the watcher" is solved by another watcher on a different provider.
A self-hosted Grafana plus Prometheus stack costs you a few hundred megabytes of RAM and gives you the same observability surface that costs hundreds a month with hosted vendors. Once you have the dashboards in place, every other service you run on the box becomes a few extra lines of YAML to monitor.
Our Linux VPS plans are sized for monitoring stacks like this. NVMe storage keeps Prometheus retention snappy, and IPv6 plus snapshots come standard. See the options.